CB1 apparatus
A general view and a scheme of the CB1 apparatus are shown in Figure 1 and Figure 2, respectively [4].
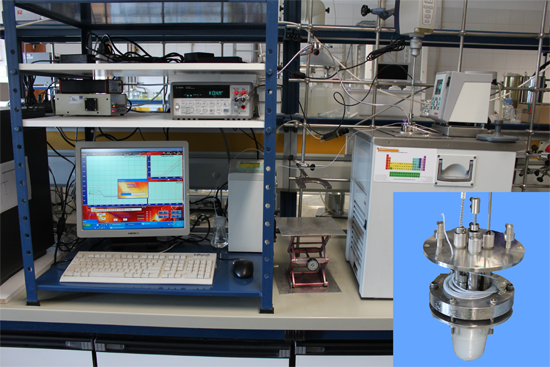
Figure 1. General view of the CB1 apparatus.
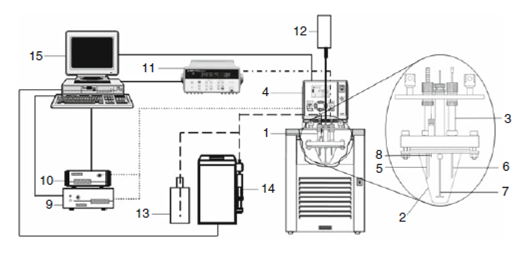
Figure 2. Scheme of the crystallization apparatus: 1 crystallization reactor; 2 glass vessel; 3 stainless steel head. 4 thermostatic bath; 5 turbidity probe; 6 platinum resistance thermometer; 7 glass impeller; 8 steel needle; 9 light source; 10 spectrophotometer; 11 multimeter; 12 stirring motor; 13 solvent dispenser container; 14 automatic burette; 15 computer.
The crystallization reactor, 1, consists of a 100 cm3 glass vessel, 2, adapted to a stainless steel lid, 3. The reactor is immersed in a JULABO F33-ME thermostatic bath, 4, containing a suitable fluid (e.g. ethanol). The temperature of the bath can be varied at a programmed rate. The lid supports a turbidity probe, 5, a platinum resistance thermometer, 6, a 4-blade 45-pitched turbine glass impeller, 7, and a steel needle, 8, that is used for solvent dispensing. The turbidity probe 5 brings light from source, 9, into the reactor and collects the dispersed light, which is then analyzed by the spectrophotometer, 10. This component enables the simultaneous acquisition of the full spectrum of the scattered light in the wavelength range 490-1024 nm. A fiber optics system connects the probe to the light source and spectrophotometer. The platinum resistance thermometer, 6, is connected in a four wire configuration to the multimeter, 11. The glass impeller is drive by a motor, 12, that controls the stirring rate to better than ±1 rpm. The concentration of the solution can be changed by adding solvent from storage flask, 13, through the needle, 8, by using an automatic burette, 14. Finally, the computer, 15, controls all experimental steps and the data acquisition, by means of a specifically designed software package.
The programmed steps and output of a representative experiment are shown in Figure 3.
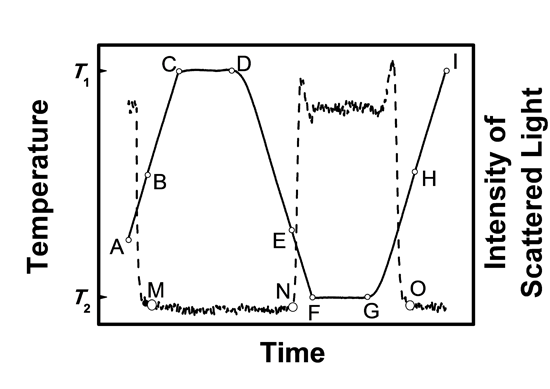
Figure 3. Temperature-time curve (solid line) and corresponding turbidity curve (dashed line) obtained in a typical experiment with the CB1 apparatus.
The initial suspension (point A) is heated at a constant rate, β, to temperature T1 (point C), which is 5 K higher than the solubilization temperature (point B). The complete dissolution of the solid is concomitant with a shift of the scattered light intensity to the baseline (point M). To minimize memory effects, the solution is left for 40 min at T1 (isothermal step between points C and D) and subsequently cooled at the rate β to temperature T2 (point F), which is 5 K lower than the nucleation temperature Tn (point E). The formation of crystals is accompanied by a rapid increase of the scattered light intensity (point N). A new 40 min isothermal step is performed at T2 (between points F and G) and this is followed by a heating ramp at the same rate β used in the cooling stage. The heating is stopped (point I) 5 K above the temperature of complete dissolution of the solid (point H). The value of Ts corresponding to point H is taken as the ‘‘equilibrium’’ saturation temperature. After reaching point I, a new isothermal step of 40 min is performed, and the cooling/heating sequence between points D and I is replicated for a different value of β, leading to new values of Ts and Tn. When runs at all the desired β values are completed for a given composition (up to 6 different heating/cooling rates can be studied in a single run), the solution is automatically diluted by adding solvent from burette 14 (Figure 2) and the described procedure is repeated for the new mixture composition.