The PAC time-window
PAC experiments are based on the so-called fundamental equation of photoacoustic calorimetry, eq 13, which allows to relate the amplitude of the signal measured by the oscilloscope, S, and the laser energy absorbed in the calorimeter cell, (1-T)E (cf. The Photoacoustic Effect chapter) [1].
| (13) |
K is the calibration constant, dependent on the instrument geometry and on the thermoelastic properties of the solvent. Like in any other calorimetry experiment, it is determined by an independent assay, a calibration, that mimics the conditions of the actual experiment but using a compound that deposits a known amount of heat in solution (as a rule we use a compound that deposits all the absorbed energy as heat). Φobs is the experimental result, the observed fraction of absorbed energy that is deposited in solution. Finally, the corresponding observed enthalpy change (ΔobsH), needed to calculate the reaction enthalpy (eq 6), is obtained simply by multiplying Φobs by the laser molar energy, Em (354.87 kJ.mol-1 for our nitrogen laser) [2]:
| (14) |
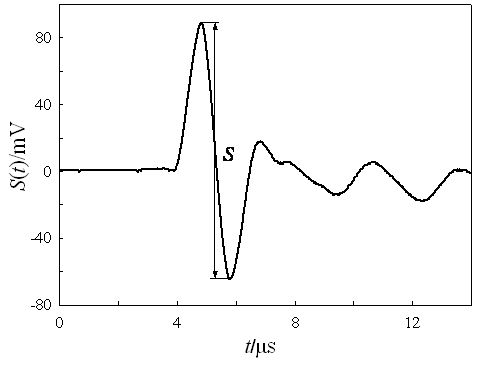
Eq 13 is deceptively simple, because it does not take into account the time-dependence of the photoacoustic signal (S) measured by the oscilloscope. In other words, eq 13 merely considers the amplitude of the photoacoustic signal. Since the signal is strongly attenuated, the amplitude is defined only for the first excursion of the wave and, for practical reasons, as the difference between its maximum and minimum (this avoids the need to define the baseline), (Figure 1).

Figure 1. A typical photoacoustic signal of amplitude S.
The description of the complete wave requires an expression much more complicated than eq 13. For instance:
(15) |
The meaning of the extra variables is as follows: τ is the lifetime of the process generated by the laser pulse, νo is the transducer (microphone) characteristic frequency, τo is the transducer relaxation time, and τ´ is an auxiliary variable defined as 1/τ´ = 1/τ - 1/τo. Note that this equation is still an approximation, valid for a spherical heat source (when in reality the signal is generated in a cylinder, corresponding to the region of the cell illuminated by the laser), observed by a point detector (in fact the microphone occupies the entire bottom of the cell), and assuming various other simplifications [3,4]. However, it explains a very important feature of photoacoustic-calorimetry: its time-window.
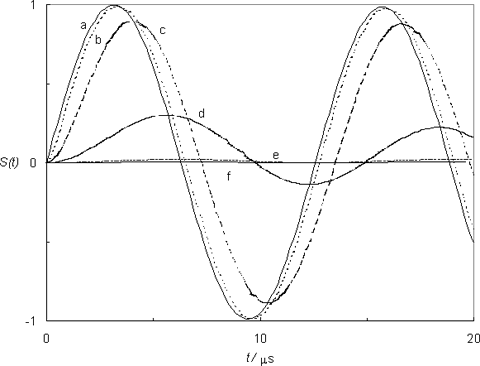
Figure 2 shows several photoacoustic waves simulated with eq 15, corresponding to processes with the same magnitude (e.g. same amount of heat deposited) but with different lifetimes. To allow a better visualization, the attenuation was minimized (by choosing τo >> 1/νo). The figure clearly identifies two limiting cases: very fast processes (lifetimes of 1 ns, 1 ps, 1 fs) all give rise to a photoacoustic wave with the same temporal profile; on the other hand, slow processes (lifetimes of 1 ms, 1 s) give rise to virtually no signal.

Figure 2. The normalized transducer response (νo = 0.5 MHz e τo = 1 ms) for processes with different lifetimes, according to eq 15: (a) τ = 1 fs, 1ps or 1 ns; (b) 200 ns; (c) 1 µs; (d) 10 µs; (e) 200 µs; (f) 1 ms or 1 s.
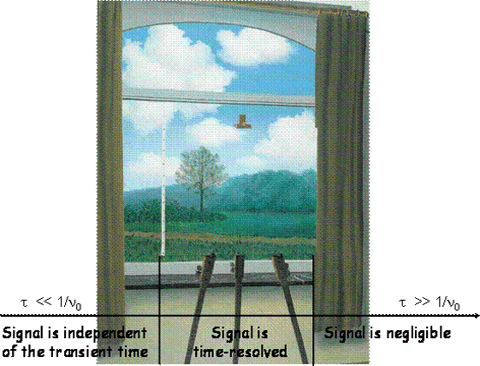
Between these limits an intermediate regime exists where each process gives rise to a unique waveform, phase-shifted and reduced in amplitude (relative to the waves corresponding to very fast processes). This is because the transducer can now “keep up” with the process, and the resulting signal can be time-resolved since it contains information about the lifetime of the process that originated it. The fast and slow limits are of course defined in relation to the microphone, more precisely to its characteristic frequency, fast corresponding to τ << 1/νo and slow to the opposite condition, τ >> 1/νo. These two limits effectively define a time-window for PAC experiments, Figure 3.

Figure 3. The PAC time-window: Magritte’s “La Condition Humaine” is used to illustrate that with PAC we cannot examine the slower processes (they are behind the curtain to the right) and, although we can see the fast processes, we cannot fully describe them (they are outside the canvas to the left). Only processes in the intermediate regime can be “portrayed” with this technique.
The experimental consequence of the time window is that the procedure outlined in the beginning of this section can only be used to examine a very fast process, whose energetics (Φobs) are evauated by a simple comparison between experiment and calibration. This procedure is called classical (or static) PAC. For the calibration we use a compound that not only deposits all the absorbed laser energy as heat but, for reasons that are now apparent, also does it very fast [1].
The procedure used in classical PAC is not valid for processes in the intermediate regime, since the signal will appear reduced in amplitude, not because there is less heat deposited in solution but because it is being “tracked” by the microphone (see waves b, c and d in Figure 2). In this case, we have to use a different experimental methodology, called time-resolved (TR) PAC. The mathematical complexity of TR-PAC analysis is, as expected, much greater than that of classical PAC: the signal-inducing event must be “separated” (deconvoluted) from other dynamics included in the signal, namely the transducer one. Furthermore, several processes could occur during the PAC time-window, either sequentially or simultaneously, and we must be able to discriminate between them as well [5]. Fortunately, the algorithms needed to tackle these problems are now commercially available in the form of computer programs, such as Sound Analysis by Quantum Northwest. The upside of all this is that TR-PAC affords not only the magnitude, and hence the enthalpy and volume changes of the processes studied, but also their lifetimes, and therefore their kinetics, allowing to draw a richer picture from the experimental results.
